

Introduction
Marine habitat maps describe the physical and biological characteristics for the Northern Territory's (NT) marine environments.
This helps to understand the impact human activities have on these environments and supports the decisions made about sustainable management of marine habitats.
This guide has information on marine habitat mapping in Territory waters, including all of the following:
- the aim of marine habitat mapping activities in the NT
- how habitats are mapped
- mapping the physical environment
- mapping plant and animal communities.
Read more about Darwin Harbour and our marine environments.
Aim of marine habitat mapping
Marine habitat mapping characterises and describes the distribution of the Northern Territory's (NT) marine native flora and fauna.
This mapping guides advice and support for the sustainable management of marine habitats in regions where there could be risks to biodiversity from human activities.
The maps provide baseline information about environmental and ecological patterns.
Marine habitat mapping aims to do all of the following:
- develop comprehensive inventories and maps of the distribution and abundance of physical and biological habitats, including detailed maps of the seafloor depth and hardness
- characterise the plants and animals living on and in the seabed
- look at the physical environment patterns important to plant and animal communities living on and in the seabed
- analyse relationships between plants, animals and physical attributes in sampled areas to allow for spatial prediction of plants and animals outside sampled areas.
How marine habitats are mapped
Marine habitat mapping uses remotely sensed data, targeted direct sampling and development of models to predict where seafloor habitats are.
Maps are built from the ground up by describing the environmental conditions, then using statistical analysis and Geographic Information System (GIS) spatial modelling tools to map the environment into similar physical conditions.
This information is shown in a physical habitat map.
Based on this map, direct sampling techniques are used to characterise plant and animal species or communities at sampling sites in each habitat.
Statistical analysis of physical and species or community data for the sample sites lets spatial analysts use physical data to predict where plants and animals may occur in other areas not sampled (species/community habitat map).
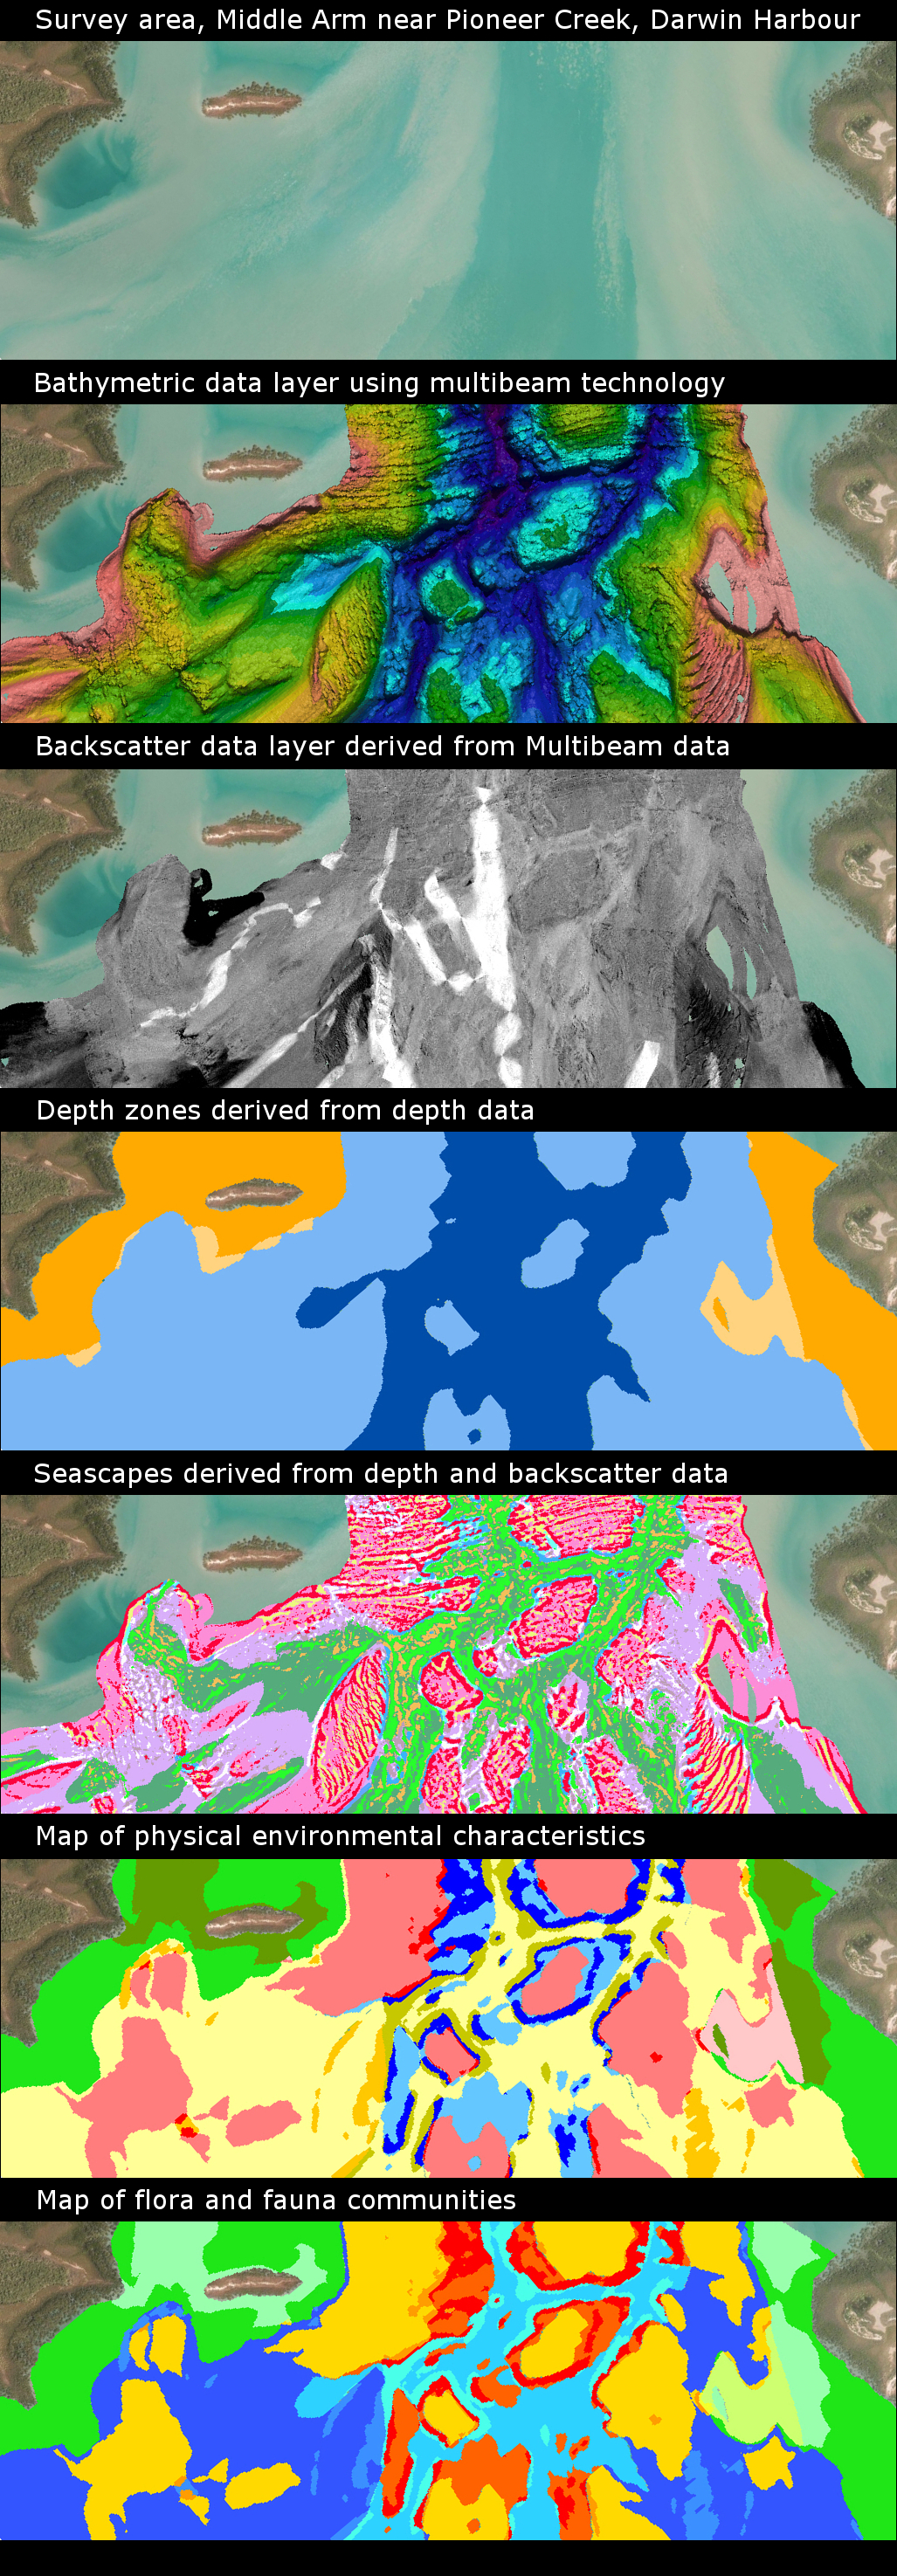
Types of marine mapping
These images show the different types of marine habitat mapping.
Marine habitat mapping tools
All of the following are examples of the tools used for creating marine habitat maps:
- remote sensing tools that use satellite imagery and/or aerial photography to map areas that are visible from the air
- remote sensing tools that use acoustic technology, such as multibeam echosounder systems to map the depth of the seafloor
- analysis of the strength of the return multibeam signal (backscatter) helps predict where it is likely that rock may occur
- water quality data, such as light availability at the seafloor, which helps predict where marine plants are likely to dominate
- modelling of depth and backscatter data will show what landscapes are present under the water
- modelling of all environmental data helps create habitat maps that have similar environmental characteristics
- predictive distribution maps can be created from modelling of species or community data with physical data.
Using the same methods, statistical analysis and GIS spatial modelling tools keep maps consistent, easy to update and improved when new data becomes available.
Mapping the physical environment
Often there is not enough biological information to map the distribution of plant and animal communities accurately.
To improve accuracy, characteristics of a physical environment are used to predict where plant and animal communities occur in marine environments.
Remote sensing technology
The first step in characterising the physical environment often uses remote sensing technologies such as satellite imagery, aerial photography and multi-beam echo sounder, to map the seafloor without data gaps.
Analysis of satellite and aerial photography are used in clear waters, while multibeam echo-sounder technology is used where light cannot penetrate to the seafloor, which is often the case for the Northern Territory's (NT) muddy waters.
Multibeam echo-sounders collect hardness and depth data for the seafloor. Hardness shows the nature of the seafloor, such as the substrate type (like rock, sand or mud).
Depth data allows a wide range of topographic characteristics to be calculated, resulting in seascape maps.
Water columns
The characteristics of a water column above the seafloor is important for mapping the physical environment.
Scientists use hydrodynamic models to map the strength and direction of currents, exposure time due to tides and the fate of sediments when moved by currents.
Others use water quality data to understand the fate and interaction of nutrients in the water column, how salinity changes across an area, light quality and suspended sediment relationships.
Spatial analysts, including habitat mappers, compile and model all the available environmental data to create maps that show areas with similar environmental and seascape characteristics.
Mapping physical characteristics is a step towards creating broad scale maps that describe the marine environment.
These maps are valuable in many aspects of marine spatial planning.
The maps also help identify data gaps and design biological sampling programs for additional benthic community and single species sampling programs.
Mapping marine plants and animals
Mapping plant and animal communities on the seabed (benthos) uses direct sampling techniques like diving, grabs, dredges, video and photography.
Information is collected at a sample site to find out what and how many species are there.
This is to assess the biodiversity values for an area of interest.
This information is used to help make decisions for sustainable development within the Northern Territory's (NT) marine environment and conservation of its native marine plants and animals.
Mapping of plant and animal species and communities extends the sample site to a broader area of interest.
Scientists combine species and environmental characteristics at a number of sites to predict where these species may be found in areas outside these sites.
The final community or species habitat map reflects the best estimate of habitat distribution.
An example of community mapping is the Darwin and Bynoe Harbours habitat mapping program.